Author: Celerion

  • Signal to Noise versus Titer: Is it time to adopt a new paradigm for clinical immunogenicity assessment?

    After a busy spring and summer season of bioanalytical conferences, we are gearing up for a full schedule this fall. From EIP in Portugal to WRIB in Texas and SSF in Ohio, Celerion’s scientific leaders have spent countless hours engaged with others in the bioanalytical community this year and have found a now-familiar topic being discussed at every event: Should Signal-to-Noise replace Titer in immunogenicity testing? Here, we establish the context and provide a few of the key considerations for understanding the nuances of this relevant and important discussion.


    Why do we test for immunogenicity using a 3-tier approach in the first place?

    In the early 2000’s, several reports of pure red-cell aplasia (PRCA) after treatment of patients with human recombinant erythropoietin started a series of investigations that eventually led to a new concern for unwanted immune responses, specifically the formation of antibodies against dosed therapeutics in clinical trials. Although the risk of immunogenicity following therapeutic administration is known to be complex and multifaceted, strategies to detect and characterize these unwanted immune responses became a critical component of safety testing strategies in subsequent years.

    Early adoption of anti-drug antibody (ADA) testing for therapeutics lacked clear definition as the first official guidance documents from global health authorities were not released until the mid to late 2000’s. As such, drug developers first drew from experience monitoring antibody responses in the vaccine field where titer was the critical measurement of efficacy. It is important to note that titers for vaccine programs are magnitudes higher than titers for most biotherapeutic drug responses. As such, scientists in the industry sought to adapt the testing strategy to better fit biotherapeutics, leading to what we now know as the three-tier approach.

    Titer was still considered the main read-out of ADA positivity, but because this method is low throughput and resource intense, titering every sample from every patient was a daunting task. Therefore, a tiered system was designed. This starts with a screening assay where samples are run at a single concentration and any sample with ADAs detectable above background (signals statistically higher than known ADA-negative samples) is identified as positive. The statistical threshold for the screening tier is set to include a 5% “false positive rate” or FPR to ensure that no low positives are missed. However, there was concern that the screening tier could detect non-specific signals for some samples. To address this, a second assay, the “confirmatory” tier, was added that identifies non-specific positives and uses a 1% FPR, thus identifying what are considered “true” ADA positive samples. Finally, samples that both screen and confirm positive are evaluated in a third assay that follows traditional titer practices where they are serially diluted to provide additional information on the strength of response, the titer value.

    Now, nearly thirty years later, the industry still reports ADA values using this approach with titer as the value. However, many people have begun to question if this approach is providing us with the appropriate data to characterize clinically impactful immunogenicity or if it is simply a case of following tradition.


    What are Signal-to-Noise (S/N) and Titer for immunogenicity assays?

    As described, the traditional 3-tiered approach to ADA testing consists of screening a sample for ADA (screening tier), confirming that positive responses from the screening tier are specific to the drug (confirmatory tier), and titering any sample that screens and confirms positive (titer tier).

    Titer is therefore a measurement of the magnitude of the immune response. It is determined through serial dilution, identifying the highest dilution that produces a detectable positive signal in the assay.

    Signal-to-Noise (S/N) is a calculation that can be performed using the data from the screening tier. It is calculated as:

    S/N = [Equation]

    This measurement can be used in place of the Titer value to determine the magnitude of an ADA response in a patient sample.


    What are the advantages of S/N over Titer?

    • Generates continuous data: Titer assays only provide data as discrete intervals, a positive or negative signal at each dilution, and it is typically only applied to samples that are advanced to this tier after they screen and confirm positive. With signal to noise, every sample tested in the screening tier generates an exact value which could lead to higher precision and better sensitivity for positive responses in the lower range of the assay. This type of data is also better suited for making comparisons between samples from the same patient over time and across analyses.
    • Streamlines sample testing: Titer assays are relatively low throughput and consume large amounts of reagents to generate the result. By using S/N, the screening tier can generate the necessary data, eliminating the need for the additional testing tier and saving both time and reagents.
    • Provides quality data for clinical interpretation: There have been numerous publications within the industry that demonstrate a strong correlation between S/N and titer values when used for clinical interpretations. Taken together with the other advantages of S/N, this means that a faster, more cost-effective way to measure the magnitude of patient ADA responses can be leveraged to generate data as good or even better than that of the traditional titer approach.

    What are the disadvantages of S/N?

    • Not every assay is appropriate for S/N: In order for S/N to provide robust, accurate measurements, the assay should have a relatively steady baseline signal from the negative controls, highly specific reagents to prevent nonspecific binding, and should be optimized to prevent hook effect or signal saturation at the upper end of the response curve when possible. If there is a hook or saturation, this phenomenon should be fully characterized to understand the impact on data interpretation as part of decision making. There have been several publications, including a recent one by McCush et al., that provide excellent examples of signal saturation and ways to derive meaningful S/N data despite this potentially complicating factor. However, it is clear that ADA assay format and performance must be thoroughly evaluated to understand if and how S/N can be appropriately leveraged.
    • S/N is a ratio, not an absolute concentration: For studies that use ADA data to determine overall magnitude of antibody responses or to characterize trends, S/N is an ideal measurement. Proponents of Titer in the industry have argued that only Titer can provide absolute endpoints, and that this data is required in some cases, negating the use of S/N. However, a standard Titer tier for ADA assays is a semi-quantitative method and does not provide an absolute value either. The base of this argument is likely derived from vaccine titer assays which utilize a global reference standard (such as the WHO International Standards) to calibrate the assay and report endpoint titers as a standardized unit rather than a dilution.
    • Validation samples may miss important confounding factors for S/N evaluations: Variability in matrices can significantly impact the background, and thus the negative control values, in an ADA assay. This can be driven by any number of factors such as high levels of drug in circulation or unanticipated interferents in the sample. If these are not accounted for during development, the S/N data generated during patient testing may be at risk. However, this is an issue that would impact Titer values as well. A counter argument for matrix impact on S/N is that the serial dilution of samples as part of a traditional Titer tier results in dilution of potential interferents in the samples which can skew the background signal for each sample in a Titer series and impact the results. By using a single dilution for the screening tier to calculate S/N, you remove that potential bias.

    Is S/N accepted as a replacement for Titer by regulatory agencies?

    As with all paradigm shifts in bioanalysis, moving from Titer to S/N is a slow process. Within working groups and at scientific meetings, the arguments for using S/N have become the overwhelming majority. In the case of regulatory acceptance, however, this continues to be a case-by-case basis and is a not universally approved strategy or an approach written into guidance. In many successful cases, drug developers have provided rigorous validation data with particular focus on linearity, precision, and robustness of the data compared with titer methods. While S/N is increasingly accepted by the FDA and EMA, sponsors are encouraged to have early discussions with the applicable agencies to communicate the scientific justification behind this approach and ensure an appropriate strategy is implemented.

    At Celerion, we work together with our clients to provide the most relevant, scientifically driven, and globally accepted solutions for immunogenicity testing. We look forward to participating in more of these impactful discussions at upcoming industry events and to helping advance the field of bioanalysis in the years to come.


    References and Additional Resources:

    Goodman, J., Cowan, K. J., Golob, M., Nelson, R., Baltrukonis, D., Bloem, K., et al. (2024). Re-thinking the current paradigm for clinical immunogenicity assessment: an update from the discussion in the European Bioanalysis Forum. Bioanalysis, 16(17–18), 905–913. doi: 10.1080/17576180.2024.2376949. PMID: 39119660.

    Lai CH, Chen M, Fraser S, Wang J, McAfee S, Speaks E, et al. (2024) Challenging the Standard Immunogenicity Assessment Approach: 1-Tiered ADA Testing Strategy in Clinical Trials. AAPS J., 27(1):11. doi: 10.1208/s12248-024-00993-9. PMID: 39663329.

    McCush F, Wang E, Yunis C, Schwartz P, Baltrukonis D. (2023) Anti-drug Antibody Magnitude and Clinical Relevance Using Signal to Noise (S/N): Bococizumab Case Study. AAPS J. 25(5):85. doi: 10.1208/s12248-023-00846-x. PMID: 37658997.

    Stevenson, L. F. (2026). Immunogenicity assays are biomarker assays: is the 3-tiered paradigm fit-for-purpose? An illustrative case study. Bioanalysis, 18(5–6), 503–516. doi: 10.1080/17576180.2026.2677736. PMID: 42199061.

    FDA Guidance for developing and validating ADA assays: https://www.fda.gov/media/119788/download
  • New FDA Hepatic Impairment Guidance: What It Means for Your Next Dedicated Study

    Sabina Paglialunga, PhD1; Natacha Benrimoh, MSc2; Angela Choi, PhD2; Aernout van Haarst, PhD1  

    1. Scientific Affairs, Celerion; 2. Data Management and Biometrics.

    After a long awaited 23 years, the FDA has updated their thinking on hepatic impairment pharmacokinetic (PK) studies. The new draft guidance reflects more than 20 years of clinical pharmacology advances and broadens applicability beyond traditional small molecules. That said, there are some important recommendations drug sponsors should be aware of.

    We’ve summarized the 5 key updated guidance recommendations that will impact your next dedicated hepatic impairment PK study:

    1. Expanding Drug Modalities for Hepatic Impairment PK Studies

    The draft guidance acknowledges that therapeutic peptides, proteins and even monoclonal antibodies as well as antibody-drug conjugates have shown altered PK in patients with hepatic impairment, and therefore a dedicated study should be considered during their development. Moreover, the FDA encourages a dedicated study to be conducted during early drug development to adequately guide late phase trial eligibility.

    Key takeaway: Biologics are no longer exempt from conducting a hepatic impairment PK study.

    1. When a Hepatic Impairment Study is Recommended

    Whereas the previous 2003 draft guidance provided a limited set of conditions when a dedicated PK study was recommended, the new 2026 draft guidance expands on this and introduces several new criteria:

    • Hepatic metabolism/excretion >30% of elimination
    • Narrow exposure margins where small PK changes matter
    • When the elimination pathways are not well characterized
    • Drug intended for liver disease
    • Drug likely to be used in patients with hepatic impairment

    Key takeaway: The criteria for conducting a dedicated study has expanded and most study drugs in development will fall into one or more of these buckets. Drug sponsors may want to consider including a hepatic impairment study in their drug program development plan.

    1. Detailed Participant Characterization

    The Child-Pugh (CP) classification system is the preferred score for categorizing participant hepatic impairment. The new guidance recommends reporting both the total and component-level CP scores.  Also, the FDA urges to report the etiology of underlying liver disease as well as assess confounding effects influencing the CP score, such as the presence of vitamin K deficiency, Gilbert syndrome, and IV fluid or anticoagulant administration. In such cases, CP scoring should be avoided.

    The new guidance also places greater emphasis on the role of pharmacogenomics, and when relevant CYP/transporter genotyping is recommended.

    Key takeaway: Greater participant characterization at the level of their liver disease etiology, factors affecting the CP score and genotype may either minimize or at least help explain potential variability in PK results.

    1. Major Changes to Study Design

    The new draft guidance recommends a full study design, covering the spectrum of liver disease including participants with mild, moderate, and severe hepatic impairment compared to matched controls.  In certain cases, the study design may include patients with severe hepatic impairment vs controls. This is a significant departure from the previous guidance, which proposed moderate hepatic impairment for a reduced design.

    In line with the 2024 renal impairment guidance, now sample size justification is required.  Based on the study drug coefficient of variability (%CV), the sample size for a hepatic impairment PK study could range from 6-12 (or more!) participants per cohort (i.e. severity group).

    Key takeaway: The recent guidance will place a greater demand on the severe hepatic impairment pool of participants, which may impact study timelines, number of clinical sites and overall study costs.

    1. Need for Additional Sample Collection and Storage

    It is well recognized that plasma proteins can be altered in patients with liver disease.  Therefore, when a study drug is extensively bound to plasma protein, defined in the guidance as fraction unbound is <10%, the sponsor should determine the unbound fraction at trough (Cmin) and maximum plasma concentration (Cmax). For PK analysis, total and unbound (free) drug concentrations should be reported.  Importantly, the new guidance adds that for study drugs that are not extensively bound to plasma proteins, the sponsor should retain and archive samples to allow for future assessment to explain unexpected observations.

    Key takeaway: Blood sample collection for protein binding will be required for most studies, whether this should be analyzed right away or stored will depend on the study drug characteristics.

    Putting It All Together

    The new draft guidance reflects the modernization of clinical pharmacology, current technologies, and more robust participant and PK characterization to support safe drug use in patients with liver disease. While these updates are welcome, they also add complexity to dedicated hepatic impairment study design. Partnering with an experienced CRO like Celerion, with decades of expertise in hepatic impairment study design, protocol development, and study management, can help sponsors navigate these recommendations efficiently. In addition, Celerion’s robust site network provides access to nearly 2000 patients with hepatic impairment across the US and EU to support study recruitment under the new guidance.

  • When to Run a UGT-Mediated DDI Trial—and Why It Matters Clinically

    Sabina Paglialunga, PhD & Aernout van Haarst, PhD, Senior Directors, Scientific Affairs, Celerion

    Clinical drug–drug interaction (DDI) programs during early drug development are often built around cytochrome P450 (CYP) enzymes and focus on phase I metabolism, but phase II metabolism can be just as consequential for patients. Phase II metabolism involves the conjugation of endogenous substrates, food compounds and drugs etc. with a polar moiety (for example, glucuronic acid, sulfate, or glutathione), making it more water-soluble for excretion.  Enzymatic glucuronidation is the most common phase II conjugation pathway for many small molecule drugs and relies on UDP‑glucuronosyltransferases (UGTs).

    There are 22 human UGTs, of which UGT1 and UGT2 superfamilies have been associated with DDIs. UGTs are highly expressed in “detoxification” organs such as liver, kidney, and intestine. They transfer glucuronic acid (GlcA) to lipophilic substrates to form hydrophilic glucuronides—often reducing biological activity, increasing solubility and enabling elimination via bile and urine.

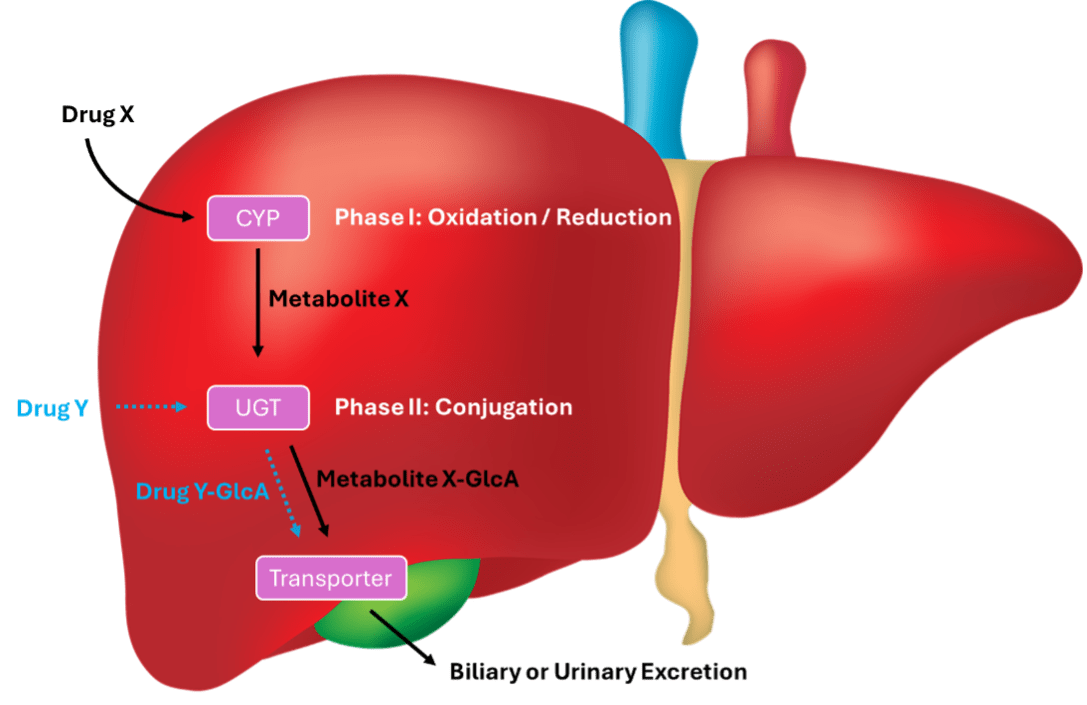
    Figure 1. Illustration of phase I and phase II Drug Metabolism Steps in the Liver

    metablolism steps in the liver

    Simplified example of a medication Drug X that undergoes both Phase I and Phase II metabolic processes. Conversely, certain drugs like Drug Y can be directly glucuronidated in the liver without going through both phases.   

    A review of the 100 most prescribed medications found that ~20% of these drugs undergo phase II metabolism. While phase II metabolism is applicable for a relatively small portion of drugs, UGT inhibition or induction can shift drug exposure enough to influence efficacy, tolerability, and risk management decisions when an (investigational) drug (or a common concomitant medication) depends heavily on glucuronidation. In some settings, UGT liability intersects with clinically meaningful endpoints such as hyperbilirubinemia, drug‑induced liver injury (DILI), dose‑limiting toxicities in oncology as well as anticancer drug resistance.

    When should you run a UGT DDI trial?

    ICH M12 recognizes that, given the generally limited magnitude of UGT inhibition–mediated DDIs, routine clinical evaluation is not always warranted. Instead, the guideline encourages a risk-based approach that considers how much the investigational drug relies on glucuronidation, how sensitive the clinical setting is to exposure changes, and how likely relevant co‑medications are in the intended population.

    • Direct Glucuronidation: If a major clearance pathway for the investigational drug (or a major active metabolite) is direct glucuronidation, UGT‑focused DDI risk becomes more clinically relevant.
    • Narrow Therapeutic Window: This may be an important consideration if there is an exposure–toxicity concern related to phase II metabolism.
    • Co‑Medication Risk: If the investigational drug will likely be co‑administered with drugs that are mainly metabolized by glucuronidation or with known UGT inhibitors/inducers, targeted in vitro evaluation should be considered and (when warranted) a clinical DDI study.
    • Synergistic Induction: UGT enzymes can be induced by xenobiotic receptors (e.g., via PXR agonists, including several moderate/strong CYP3A inducers). When a study drug’s exposure is reduced by >50% when co-administered with a strong CYP3A inducer, it may be recommended to conduct a DDI trial with a UGT inducer. This becomes an important consideration when induction is plausible in the intended population and if exposure changes would be clinically meaningful.

    From an in vitro perspective, ICH M12 highlights a set of UGTs that are commonly informative for drug development risk assessment (including UGT1A1, UGT1A4, UGT1A9, UGT2B7, and UGT2B15). If in vitro data and the overall risk assessment suggest potential clinical relevance, a clinical DDI evaluation can be designed around the most plausible interaction mechanism (inhibition vs induction vs substrate). For an inhibition role of a study drug it is important to consider the likelihood of its concomitant use with UGT substrates, as well as the safety profile of the interacting drug. The ICH M12 guidance provides a list of recommended UGT substrates, inhibitors and inducers for clinical studies.

    Key Study Design Considerations for Clinical UGT DDIs:

    • Measure parent and glucuronide metabolites to elucidate metabolic pathway. Quantifying glucuronide conjugates alongside parent drug concentrations can clarify whether an exposure change is driven by altered formation vs altered clearance and whether metabolites contribute to efficacy or safety (particularly when metabolites are active or reactive).
    • Exposure magnitude: DDIs via UGT inhibition generally show less magnitude (measured by AUC ratio) compared to CYP inhibition. However, these may be clinically relevant depending on the patient population and risk of co-medication.
    • Metabolite interference: Some drugs like gemfibrozil, form acidic glucuronides that can act as metabolism-dependent inhibitors of other enzymes, like CYP2C8.
    • Use pharmacogenomics to bound risk. Functional variants in UGT enzymes (commonly discussed include UGT1A1 and several UGT2B genes) can shift pharmacokinetics and help estimate the range of exposure in the presence of inhibition/induction. In practice, inhibition effects may be most visible in individuals with lower baseline UGT activity.

    Getting UGT Right!

    UGTs are increasingly recognized not only as a clearance pathway, but also as a lever that can shape exposure, safety, and treatment recommendations. Since, in some cases, UGT drug interactions can result in DILI concerns or hyperbilirubinemia, a clinical investigation in healthy volunteers can help determine the risk. The goal is not to run “every possible” UGT DDI study—it’s to run the right study at the right time, guided by clearance pathways, exposure–response, and real‑world concomitant medication use. That said, Celerion has conducted more than 450 DDI studies, our experienced team of Protocol Writers and Scientists can advise on the right UGT DDI study design to meet your program needs.

    Selected references
    1. International Council for Harmonisation (ICH). Drug Interaction Studies M12. Final guideline adopted 21 May 2024.
    2. Iversen DB et al. Drug metabolism and drug transport of the 100 most prescribed oral drugs. Basic Clin Pharmacol Toxicol. 2022; 131:311–324.
    3. Williams JA et al. Drug–drug interactions for UDP‑glucuronosyltransferase substrates: a pharmacokinetic explanation for typically observed low exposure (AUCi/AUC) ratios. Drug Metabolism and Disposition. 2004; 32(11):1201-8
    4. Meech R et al. The UDP-Glycosyltransferase (UGT) Superfamily: New Members, New Functions, and Novel Paradigms. Physiological Reviews 2019, 99:2, 1153-1222
    5. Shah MB. Inhibition of CYP2C8 by acyl glucuronides of gemfibrozil and clopidogrel: pharmacological significance, progress and challenges. Biomolecules. 2022; 2(9):1218
  • Cocktail DDI Studies: Myths vs. Facts

    Sabina Paglialunga, PhD & Aernout van Haarst, PhD, Senior Directors, Scientific Affairs, Celerion

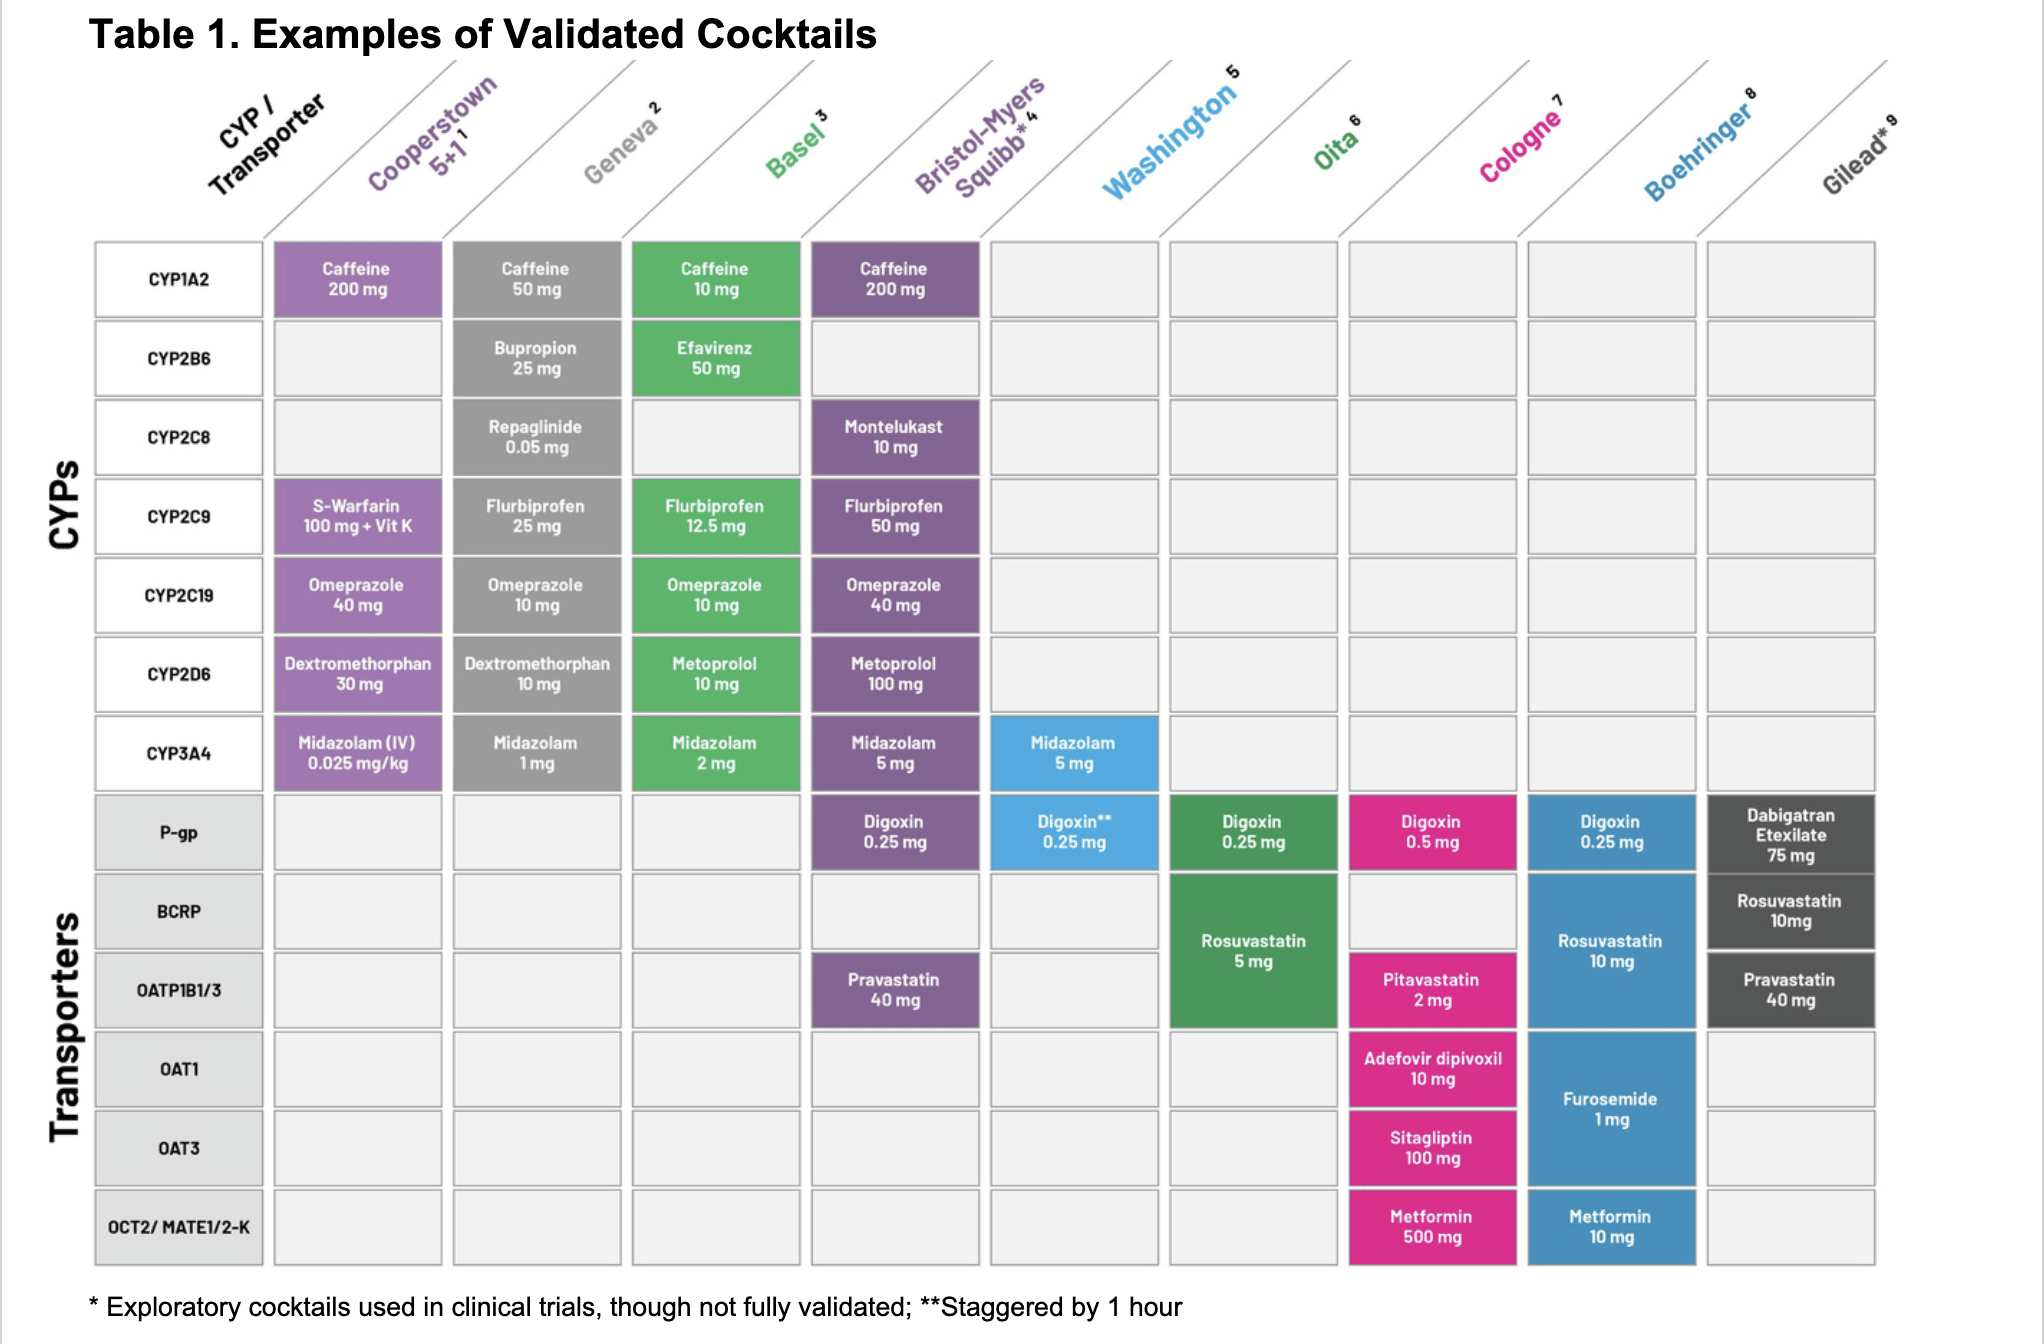
    Cocktail drug-drug interaction (DDI) studies are an efficient and effective approach to simultaneously evaluate the effect of a study drug on multiple CYP450 enzymes and transporter substrates at once. Advantages of this approach include a potential reduction in the number of DDI studies, overall shortening of clinical study timelines, cost savings and faster data access.  At Celerion, we regularly run cocktail DDI trials, with over a dozen studies completed in the past 3 years.

    Well-known and popular substrate cocktails for CYPs and transporters include:

    Examples of Validated Cocktails

    While substrate cocktails were first introduced in the FDA DDI guidance in 2006 [10] as an option for drug developers, some sponsors may be hesitant with applying this approach. In this blog article, we break down 5 common myths surrounding cocktail DDI studies, and provide facts to support this efficient strategy:

    5 Common Myths About Cocktail DDI Studies:

    Myth #1: It is not safe to combine all these drugs.

    FACT: Validated substrate cocktails have undergone rigorous safety testing in a healthy volunteer population. At the given drug doses tested, they have been found safe to combine in a cocktail.

    Myth #2: There may be PK interactions among the probe drugs.

    FACT: In addition to safety assessments, validated cocktails were shown not to interact from a PK perspective at dose levels relevant to the clinical dose, nor to interfere with mutual bioanalytical assays. Each substrate in the cocktail was assessed alone and in combination with the other probe drugs during the validation process. For example, in the Cooperstown 5+1 cocktail, which combines caffeine (CYP1A2 substrate), warfarin (CYP2C9 substrate) + vitamin K, omeprazole (CYP2C19 substrate), dextromethorphan (CYP2D6 substrate) and midazolam (CYP3A substrate), PK and safety of the cocktail were evaluated for each component alone and as a cocktail [1].

    Myth #3: Regulatory agencies won’t accept cocktail DDI data.

    FACT: The FDA has been encouraging use of substrate cocktails since 2006 [10], and this recommendation is reiterated in the most recent ICH M12 guidance published in 2024 [11]. Moreover, based on our internal records, approximately 25% of approved new molecular entities (NME) have employed a cocktail DDI during development.

    Myth #4: Validated cocktails don’t address all the CYPs / transporters of interest for my study drug.

    FACT: If there is no validated cocktail available covering all the CYP’s and transporters that are relevant for a particular new drug, we encourage a staggered/sequential design approach. In such a design, sequential administration of several (cocktails of) substrates can be incorporated into a single DDI arm. As many substrates have short half-lives, sequential administration may only add a couple of extra days to overall study conduct.

    Myth #5: The total blood volume will be too high.

    FACT: When applying a cocktail DDI approach, blood samples need to be collected for bioanalysis of each individual probe. The total blood collection volume is therefore higher than typically observed in a single-substrate DDI study. However, in our experience the total blood volume collected in cocktail DDI studies in general remains well below the recommended maximum collection limit of 500 mL, which in part can be attributed to our validated bioanalytical substrate assays being optimized to use the smallest blood sample volume to help keep total blood collection volume to a minimum. Particularly in cases where blood collection volume may reach a critical value, development and validation of combined assays for multiple probes may offer a means to further reduce the volume of blood draws.

    Cheers to the Cocktails!

    In summary, the use of validated substrate cocktails in clinical DDI studies is well supported by both regulatory agencies and a robust body of scientific evidence. Common concerns regarding safety, PK interactions, regulatory acceptance, comprehensiveness of CYP/transporters coverage, and blood volume requirements can be thoroughly addressed through careful study design, validation of cocktails and ongoing advancements in bioanalytical methodologies. As a result, cocktail approaches have become a trusted and efficient strategy to evaluate metabolic pathways, streamline clinical development, and ultimately enhance the safety of both trial participants and target patient populations.

    Our expert team of PK scientists can help optimize your next substrate DDI study with the thoughtful and efficient application of cocktails. Cheers!


    References:

      1. Chainuvati et al. (2003) CPT
      2. Aurinsalo et al. (2025) CPT
      3. Suenderhauf et al. (2020) BJCP
      4. Tye et al. (2016) Int J Pharm
      5. Kirby et al. (2006) JCP
      6. Otani et al. (2019) CTS
      7. Trueck et al. (2019) CPT
      8. Wiebe et al. (2020) Clin PK
      9. Younis et al. (2023) Clin PK
      10. FDA (2006) Drug Interaction Studies — Study Design, Data Analysis, and Implications for Dosing and Labeling. https://downloads.regulations.gov/FDA-2006-D-0036-0002/attachment_1.pdf
      11. ICH (2024). Drug Interaction Studies M12. https://database.ich.org/sites/default/files/ICH_M12_Step4_Guideline_2024_0521_0.pdf
  • The Resurgence of Antibody Drug Conjugates: How ADCs are taking over oncology (again) and what we’ve learned about creating bioanalytical methods to support preclinical and clinical success.

    Michelle Miller, PhD, Global Senior Scientific Director, Bioanalytical Services

    What is an ADC?

    Antibody Drug Conjugates (ADCs) consist of a monoclonal antibody linked to a cytotoxic payload. The antibody binds to a cancer antigen, resulting in the targeted delivery of the payload to the tumor site. This potent approach to immunotherapy is often referred to as a “magic bullet” and has become a highly successful approach in oncology. Key aspects of ADC design include the stability of the linker (stable versus cleavable) and the amount of drug per antibody (Drug-Antibody Ratio or DAR) in addition to the antibody specificity for the antigen of interest.

    A Brief History of ADC Therapeutics:

    ADCs have had a long, tenuous journey over the last forty years. The first generation of ADCs reached the clinical trial stage in the 1980’s. These consisted mainly of murine antibodies and early variations were associated with high levels of off-target toxicity. It wasn’t until the year 2000 that the first ADC received FDA approval. Yet even this drug, Pfizer’s Mylotarg, had a problematic timeline, being withdrawn from the market in 2010 before re-approval in 2017.

    In the last decade, cell therapies have been the new modality leading the way in the immunotherapy space but after a number of serious setbacks and significant manufacturing challenges for cell therapy products, ADCs began to return to the spotlight. Drug developers have continued to improve upon ADC design with better linker technologies, modified antibody structures, and an expanded selection of payload molecules contributing to more advanced ADC drug candidates.

    In 2021 alone, 11 ADCs received approval from the FDA and there are currently an estimated 200 new ADCs in clinical trials. The global market for ADCs has grown dramatically and is projected to reach $32.11 billion USD by 2033.

    Bioanalytical Testing Strategies for ADCs:

    Testing of investigational ADCs in clinical studies requires specific solutions for several unique challenges. In addition to the clinical concerns associated with narrow therapeutic windows and low tumor penetration, the bioanalytical strategy for clinical sample analysis of ADCs requires careful planning. In particular, the multidomain structure and the stability of the conjugated components can lead to complex pharmacokinetic measurements and necessitate strategic approaches to immunogenicity method development.

    To overcome dose-limiting toxicities from premature payload release, the stability or target-specific cleavability of the linker is a major consideration in ADC design. Understanding the timing, efficiency, and location of linker cleavage is therefore a critical aspect of characterizing the drug absorption, distribution, metabolism, and excretion (ADME) profile. Distinct PK methods must be designed to detect the different forms of the drug including conjugated (antibody+linker+drug) and unconjugated (antibody or drug alone) variations. Multiple assays can be used together to form the full picture.

    Common bioanalytical strategies include:

    Total Antibody – ligand binding assay; quantitates the antibody component of the ADC with reagents designed to capture/detect conjugated, partially unconjugated, or fully unconjugated forms
    Conjugated Antibody – ligand binding assay; quantitates antibody with at least one linker-drug component, can be designed to be DAR specific if appropriate reagents are available
    Unconjugated Drug – LC-MS; small molecule drug/payload not conjugated to the antibody
    Total Drug – LC-MS; incorporates a sample digestion to quantitate both unconjugated and conjugated drug
    Anti-drug antibody (ADA) methods to monitor humoral immune responses against the ADC are a required part of bioanalytical testing. For most ADA assays, a bridging format is preferred which uses plate-bound ADC to capture any ADAs from patient samples and digoxin or ruthenium-labeled ADC to detect the bound ADAs. In this approach, antibodies directed against any of the three regions of the therapeutic can be detected in a single method. However, the multidomain structure of ADCs may necessitate additional characterization of ADA responses to better understand the immunogenic potential of each part separately.

    Positive controls for these assays are a critical reagent used to demonstrate assay sensitivity, specificity, and precision during ADA assay development. The most common type of positive control is an anti-idiotypic antibody which targets the variable region of the drug antibody. However, if domain characterization studies are part of the immunogenicity strategy, additional antibodies that specifically bind to the payload and linker regions are required.

    The Difference Experience Makes:

    ADCs are a powerful tool in cancer therapy, combining the specificity of monoclonal antibodies with the potency of cytotoxic small molecules. The complex and heterogenic nature of these modalities requires specialized understanding and careful planning to ensure the appropriate solutions are in place for successful PK and immunogenicity measurements in support of clinical testing.

    At Celerion, we have deep expertise in designing and implementing phase- and modality-appropriate PK and immunogenicity bioanalytical strategies. With over 50 years of experience in method development, validation, and sample analysis, our scientific teams provide unparalleled bioanalytical support across the pharmaceutical and biotech industries. Our GLP, GCP/GCLP, CLIA/CAP certified laboratories are equipped with state-of-the-art equipment and offer a full suite of bioanalytical services including LC-MS, MSD, and ELISA methods for ADC testing.

  • Celerion Welcomes Dr. Steven Evans as Senior Cardiologist to Enhance Cardiovascular Safety in Clinical Trials

    LINCOLN, Neb.; Nov. 20, 2025 (Business Wire) – Celerion, a global leader in early-stage clinical research, announced the appointment of Dr. Steven Evans as Senior Cardiologist. In his new role, Dr. Evans will strengthen the company’s commitment to participant safety and data integrity by providing expert cardiovascular oversight.

    Dr. Evans’ responsibilities will be central to Celerion’s clinical trial operations. He will perform detailed ECG and Holter review and analysis, adhering to strict protocols. He will also serve as a key consultant to the Principal Investigator team to monitor the safety of participants enrolled in clinical trials and serve as an educational resource on cardiovascular matters. His functions are integral to upholding Celerion’s reputation as an industry leader in early-phase studies.

    His responsibilities include providing consultative services for safety ECG reviews, analyzing continuous digital Holter recordings for potential dysrhythmia, and promptly alerting investigators to any serious adverse clinical events identified in cardiovascular data. These critical tasks directly support patient safety and preserve the high-quality data Celerion is known for.

    Dr. Evans joins Celerion with extensive experience in cardiac electrophysiology. He completed his fellowship at Cedars-Sinai Medical Center, established the EP program at Long Island Jewish Hospital, and later continued his clinical and research work at Beth Israel Medical Center. He has also consulted for top medical device companies such as Johnson & Johnson, Boston Scientific, Medtronic, and currently serves as Consultant Medical Director for Orchestra Biomed.

    “We are delighted to welcome Dr. Evans to the Celerion team,” said Phil Bach, Celerion’s Executive Vice President of Global Clinical Research. “His extensive expertise in cardiac electrophysiology and his proven track record in both clinical practice and research will be invaluable. We are confident that his contributions will significantly enhance our cardiovascular safety capabilities and reinforce our mission to help our clients get their products to market faster.”

    About Celerion

    Celerion, a global leader in early clinical research, offers clients expert-driven services that enable fast, informed decisions in drug development. With over 50 years of experience, Celerion specializes in Phase 1 studies, including first-in-human dose escalation, drug-drug interactions, cardiac safety, bioequivalence, metabolism, and pharmacokinetics in patient populations. Celerion also provides comprehensive data management, biostatistics, clinical monitoring, and bioanalytical services. For more information, visit www.celerion.com. 

  • Celerion Earns AAHRPP Full Reaccreditation for Five Years, Strengthening Commitment to Ethical Research Practices

    LINCOLN, Neb.; Oct 9, 2025 (Business Wire) – Celerion, a leader in early clinical research, proudly announces its achievement of a full AAHRPP (Association for the Accreditation of Human Research Protection Programs) reaccreditation for five years by the Council on Accreditation of AAHRPP. Celerion is the only CRO headquartered in the USA to hold this distinguished accreditation. This prestigious recognition underscores Celerion’s unwavering dedication to maintaining the highest ethical standards, safeguarding participant welfare, and fostering excellence in clinical research.

    AAHRPP accreditation is a coveted distinction in the research industry, signifying that an organization upholds rigorous standards for human research protection. By achieving this reaccreditation, Celerion strengthens its position as an industry leader and its ongoing commitment to advancing groundbreaking clinical studies in a safe and ethical manner.

    “This milestone represents the hard work and dedication of our entire team,” said Phil Bach, Celerion’s Executive Vice President of Global Clinical Research. “We are deeply committed to upholding participant safety and the highest ethical standards in our research. Earning AAHRPP reaccreditation for five years reflects our steadfast focus on setting the benchmark for clinical research excellence and integrity. We are honored to receive this recognition and remain focused on making meaningful contributions to the field of clinical development.”

    The AAHRPP accreditation process is rigorous, requiring a comprehensive evaluation of an organization’s policies, practices, and commitment to continuous improvement in human research protection. This achievement reinforces Celerion’s capability to manage complex clinical programs while prioritizing the well-being of participants—an essential element of ethical research practices.

    With over 50 years of experience in clinical research, Celerion has earned a global reputation for innovation and leadership. This reaccreditation not only validates the company’s dedication to regulatory compliance but also sets it apart as a trusted partner for sponsors seeking to conduct high-quality research.

    About Celerion

    Celerion, a global leader in early clinical research, offers clients expert-driven services that enable fast, informed decisions in drug development. With over 50 years of experience, Celerion specializes in Phase 1 studies, including first-in-human dose

    escalation, drug-drug interactions, cardiac safety, bioequivalence, metabolism, and pharmacokinetics in patient populations. Celerion also provides comprehensive data management, biostatistics, clinical monitoring, and bioanalytical services. For more information, visit www.celerion.com.

  • PBMCs or Whole Blood? Strategic Applications in Phase I Studies

    Studying peripheral blood mononuclear cells (PBMCs) reveals cell-specific biomarkers—like target engagement and receptor occupancy—that improve decision-making in Phase I clinical trials. This makes these assays incredibly powerful tools in early-phase studies and has resulted in a growing trend of incorporating PBMC isolation and flow cytometry in Phase I clinical studies.

    PBMCs are a group of white blood cells with a single nucleus, separated from whole blood through centrifugation. They include monocytes, lymphocytes, dendritic cells, T cells, B cells, and natural killer cells.

    In this blog article, we’ll compare PBMCs and whole blood sample types and review their strategic applications in Phase I trials. We’ll also show how Celerion’s expertise in PBMC isolation and flow cytometry can accelerate your clinical program.

    What Is Flow Cytometry?

    Flow cytometry is a technique that measures cells in suspension. The cells are tagged with a fluorescent molecule that absorbs light at a specific wavelength and re-emits light at a longer wavelength. This can be leveraged to ‘gate’ or sort a specific cell population.

    Why Choose PBMCs Over Whole Blood in Phase I Assays?

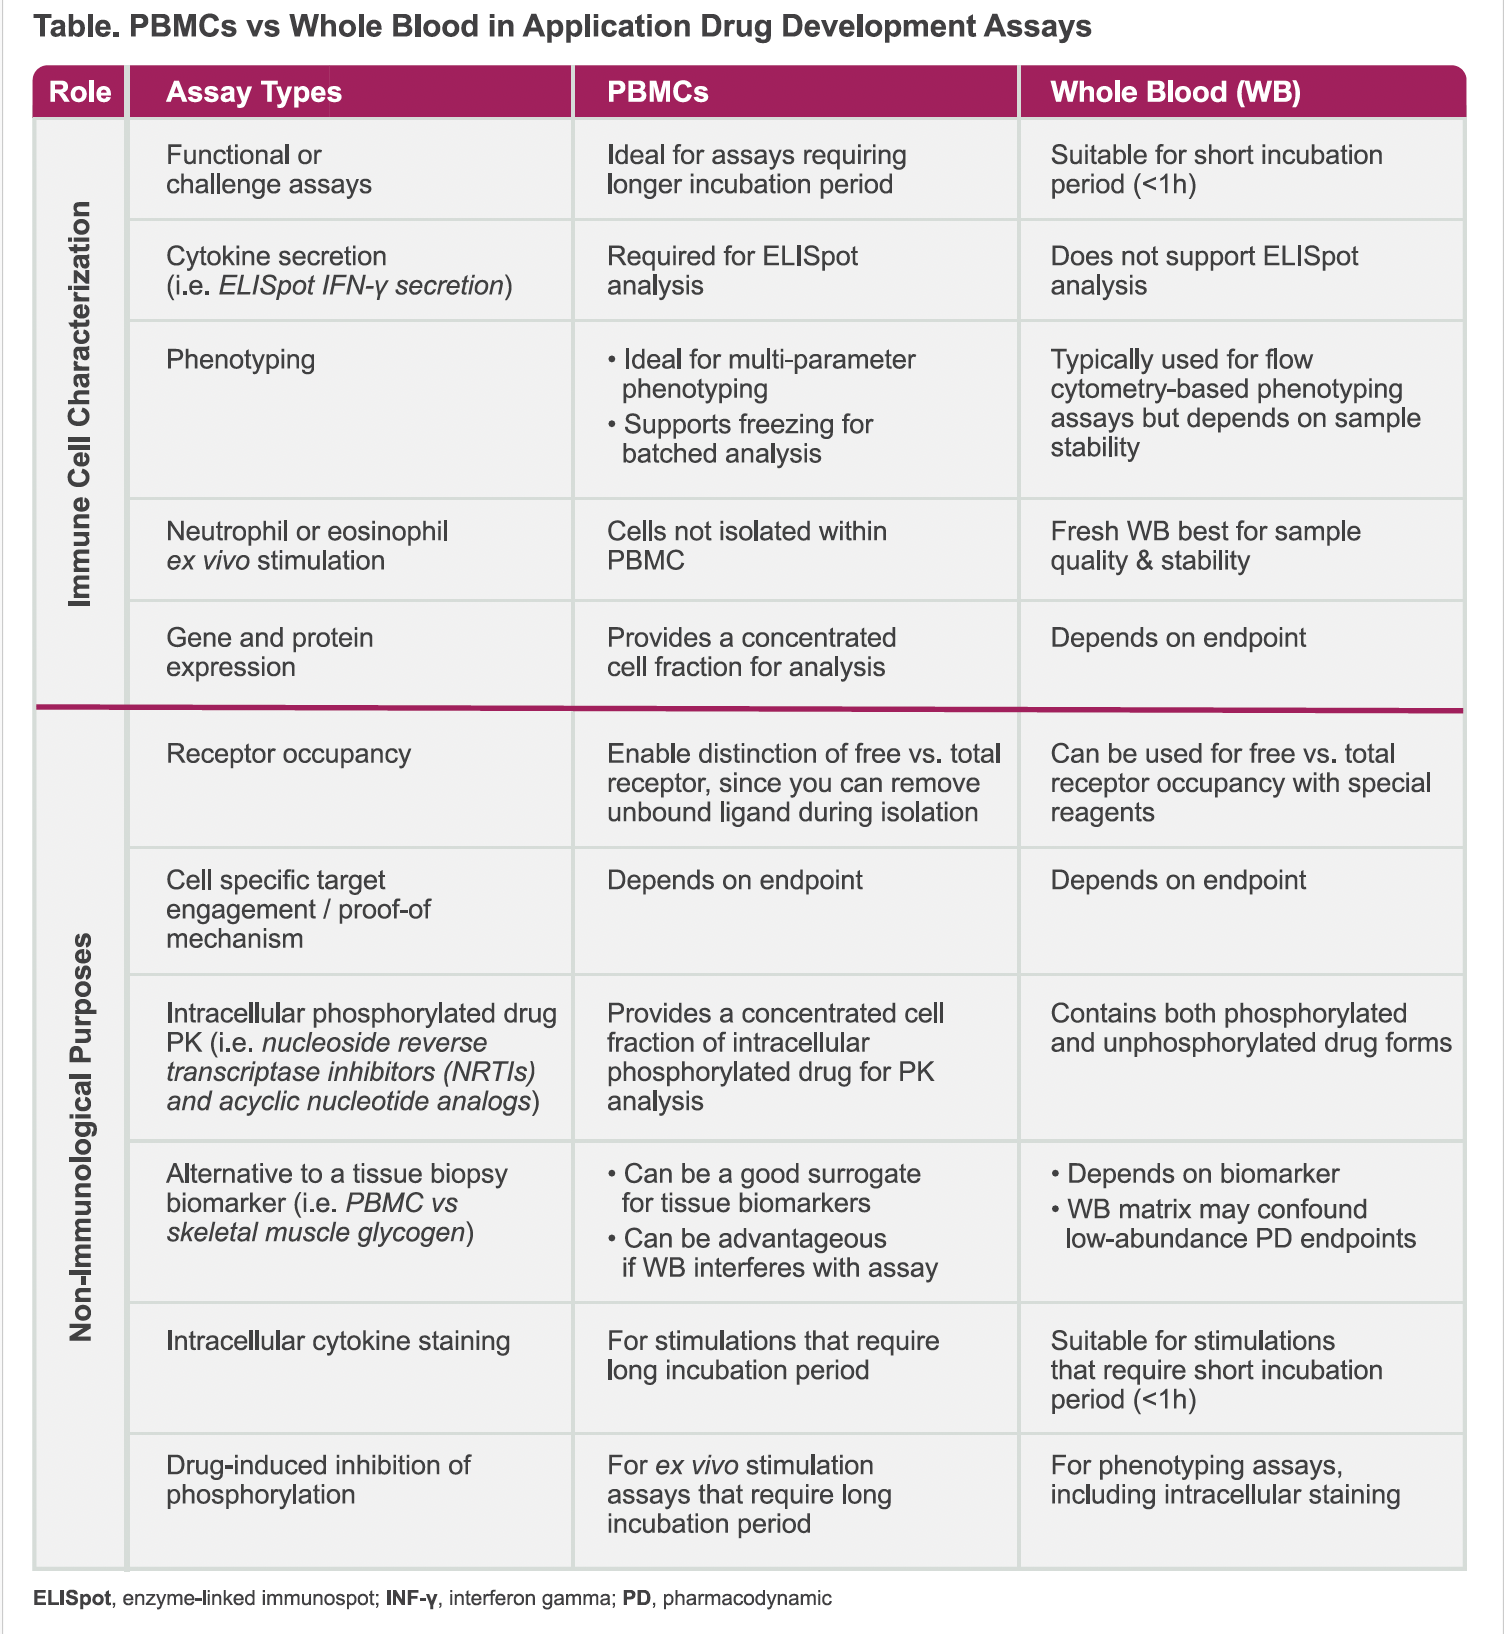
    Whole blood contains red blood cells, PBMCs, platelets as well as hormones, lipids, proteins. While whole blood requires little initial sample handling compared to the PBMC isolation process. PBMC isolation can be advantageous, supporting several downstream analyses, such as ELISpot. In addition, the whole blood components may interfere with the assay and hinder stimulation or incubation of cells with targeted reagents, therefore PBMC isolation and appropriate cell culture environment are preferred.

    Table. PBMCs vs Whole Blood in Application Drug Development Assays

    Innovative Approaches to Clinical Pharmacology

    Beyond immune characterization, PBMCs offer novel opportunities in clinical pharmacology. PBMC isolation and flow cytometry has traditionally been applied for immune cell characterization and biologics, however this procedure can also be leveraged for small molecules and for non-immunological purposes. In particular, PBMC isolation can support clinical pharmacology studies, for example:

    • Deeper Insights: PBMCs can provide deeper insights into cell-specific target engagement and intracellular drug activity, enhancing the understanding of drug mechanisms and effects.
    • Less Invasive Alternatives: PBMCs can potentially replace invasive procedures, such as skeletal muscle biopsies, by serving as surrogate biomarkers for tracking drug effects and activity.
    • Versatility: PBMCs can be leveraged for small molecules and non-immunological purposes in addition to biologic drug development, expanding their applicability in various clinical pharmacology studies.

    Our PBMCs Experts are Ready to Support your Next Study

    These approaches and their strategic applications were discussed early this year with industry peers at the ASCPT 2025 conference in Washington, DC, highlighting the growing role of PBMC-based assays in accelerating early-phase drug development.

    Celerion has experience with incorporating PBMCs into a variety of clinical pharmacology studies including SAD/MAD, bioavailability, food effect, drug-drug interaction (DDI) and renal/hepatic impairment, as well as bioanalytical support for late phase studies. At Celerion, our expert clinical pharmacology & bioanalytical team can help unlock your next study by gaining deeper insights with PBMC & flow cytometry technology.

  • The Rising Tide of Weight Reduction Therapies

    Sabina Paglialunga, PhD Senior Director, Scientific Affairs

    Weight reduction drugs are making a big splash! Since glucagon-like peptide 1 (GLP-1) receptor agonists were first approved for weight loss in 2021, there has been an estimated 700% increase in prescriptions in the US.1  This has led to a wave of new GLP-1 and incretin products entering into clinical research.  Currently, there are nearly 150 novel GLP-1 receptor agonists in various stages of drug development globally.2 Beyond GLP-1, there are several other targets being explored for weight loss, also eager to swim in the same waters. In response, the Food and Drug Administration (FDA) recently updated guidance for industry to support drug development: Obesity and Overweight: Developing Drugs and Biological Products for Weight Reduction

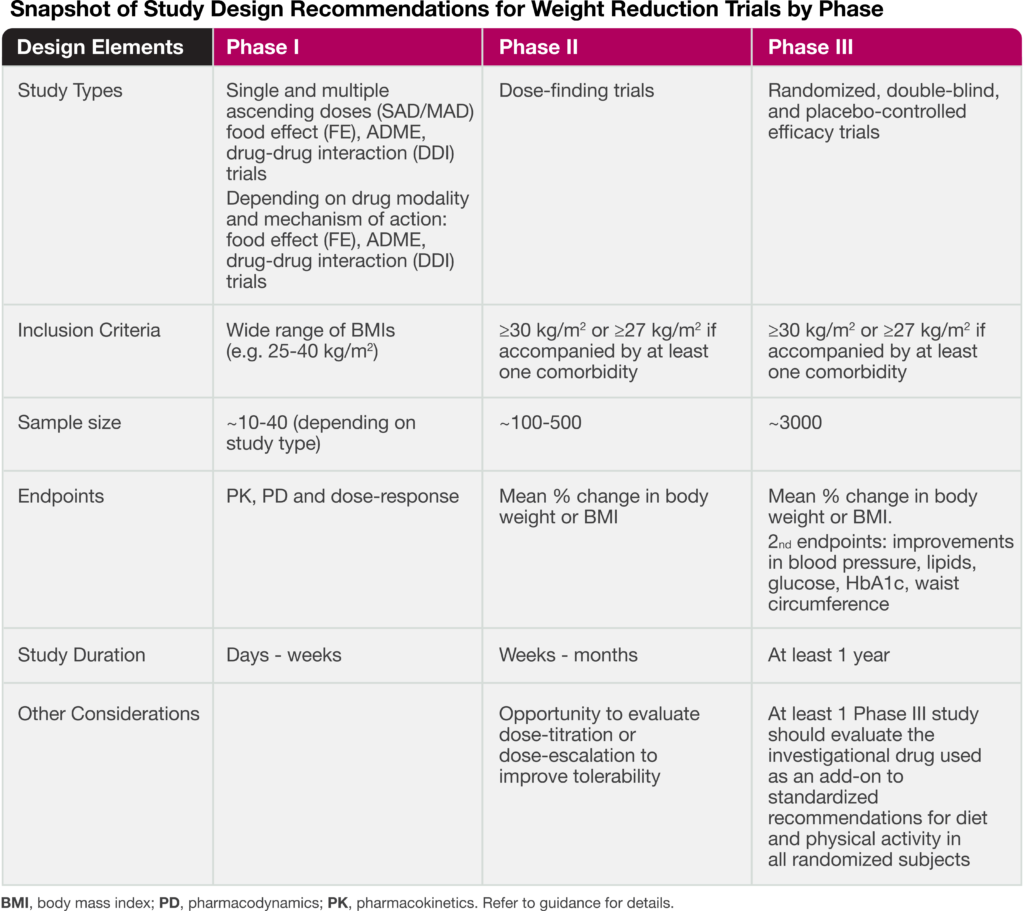
    The guidance addresses key aspects for drug developers, including recommendations for early and late phase trials, as well as input on sample size and primary endpoints. The following table highlights important study design elements.

    As recently discussed in our blog article: Reframing the Definition of Obesity, the draft guidance also places emphasis on utilizing body mass index (BMI) for inclusion/exclusion criteria as well as the percent change in BMI for a primary endpoint.  The FDA recognizes that while BMI is not a direct measure of adiposity (fat mass), it is a simple and effective assessment in which at least a 5% reduction is generally associated with improvement in metabolic and cardiovascular risk factors. In addition, to ensure the weight reduction effect is not due to loss of lean-body mass, body composition assessment by dual x-ray absorptiometry (DEXA) or another imaging modality is highly advised.

    Safety Assessments for Weight Reduction Drugs

    In terms of safety assessments, the FDA recommends monitoring changes in blood pressure and lipids. Early phase studies, such as SAD/MAD, also provide an opportunity to assess proarrhythmic risk (i.e., QTc prolongation), as well as immunogenicity potential for biologic therapies, including peptide drugs. The guidance also recommends including C-SSRS questionnaires for centrally acting drugs and echocardiographs for serotonin inhibitors.

    Combination Products

    Common adverse events associated with current GLP-1 therapies include nausea, vomiting, and muscle mass loss. To that end, an emerging trend is to optimize weight loss and minimize potential side effects with combination products.  The guidance recommends assessing the safety and PK of each component in Phase I studies prior to initiating late-stage fixed-combination drug products trials.

    Diving into Celerion’s Weight Reduction Experience

    Celerion has extensive experience with a wide range of compounds for weight reduction, including GLP-1 receptor agonists, insulin sensitizers, and microbiota products. Our comprehensive experience with anti-obesity drugs covers all aspects of development; from first-in-human studies and proof-of-concept trials to clinical pharmacology studies to support labeling, such as drug-drug interaction – and bioavailability/bioequivalence studies.

    Conclusion

    As research in this indication continues, one can anticipate that the next generation of weight reduction therapies will render better safety profiles, more convenient drug administration (e.g., oral products or less frequent subcutaneous dosing), and improved patient adherence.  Celerion is ready to help navigate the regulatory waters and support drug developers by leveraging our early phase clinical research experience, expertise, and efficiencies for smooth sailing ahead!

    References

    1. Gratzl, S et al. Monitoring Report: GLP-1 RA Prescribing Trends – June 2024 Data. medRxiv 2024.01.18.24301500; doi: https://doi.org/10.1101/2024.01.18.24301500
    2. GlobalData search,14-Feb-2025.


  • Celerion Launches Enhanced Version of Labnotes Bioanalytical Data Management Software 

    LINCOLN, Neb.; May 6, 2025 (Business Wire) – Celerion, a global leader in early clinical research and bioanalytical services, announced the launch of the latest version of Labnotes, its cutting-edge bioanalytical electronic laboratory notebook software, elevating data handling and analysis capabilities for sponsors. 

    The latest system enhancements streamline laboratory documentation and improve operational efficiency for users. The updated platform also offers advanced tools for handling and organizing large datasets, ensuring faster processing of reports and optimized database queries. 

    “With this enhanced version, Celerion underscores its commitment to expanding the use of cutting-edge technology to support its clients in achieving business success,” said Chad Briscoe, Executive Vice President of Global Bioanalytical Services at Celerion. “These improvements demonstrate our continued commitment to innovation and excellence in all facets of our laboratory operations.” 

    Celerion also introduced robust features to support security and flexibility. Enhanced encryption and secure access controls guarantee data protection, while new archiving and extraction tools enable secure data sharing without requiring the core software. Additionally, the inclusion of a Report API allows seamless integration with external reporting tools, providing users with tailored reporting capabilities to meet their specific needs. 

    “Our approach to software development is rooted in customer feedback and the latest industry trends. The updates in Labnotes empower clients with robust tools to manage and analyze their data effectively, enabling better decision-making and driving impactful business outcomes, said Mark Williams, CEO of Terrington Data Management. 

    About Celerion 

    Celerion, a global leader in early clinical research, offers clients expert-driven services that enable fast, informed decisions in drug development. With over 50 years of experience, Celerion specializes in Phase 1 studies, including first-in-human dose escalation, drug-drug interactions, cardiac safety, bioequivalence, metabolism, and pharmacokinetics in patient populations. Celerion also provides comprehensive data management, biostatistics, clinical monitoring, and bioanalytical services. For more information, visit www.celerion.com. 

    About Terrington Data Management 

    Terrington Data Management provides specialist software solutions to a variety of international customers, including clients within Oil, Gas, Pharmaceutical, Chemical and Manufacturing Sectors. The company’s software is designed to securely store, collect and utilize business information in order to improve overall business workflow. 

    Labsform, DocMan and OPAL were developed to meet the requirements of laboratory scientists working in tightly regulated bioanalytical laboratories to enhance productivity, streamline workflows and improve compliance. The software has since been used in laboratories across the world serving a variety of disciplines from R & D to clinical management. For more information, visit www.labsform.com.